/Orlo%202.0%20Logo.png?height=120&name=Orlo%202.0%20Logo.png)
Understanding your Campaign Analytics Report is key to gauging your success and identifying areas of improvement, not to mention making it easier to shout about your amazing ROI. We’ve put this glossary together to ensure every bit is easy to digest.
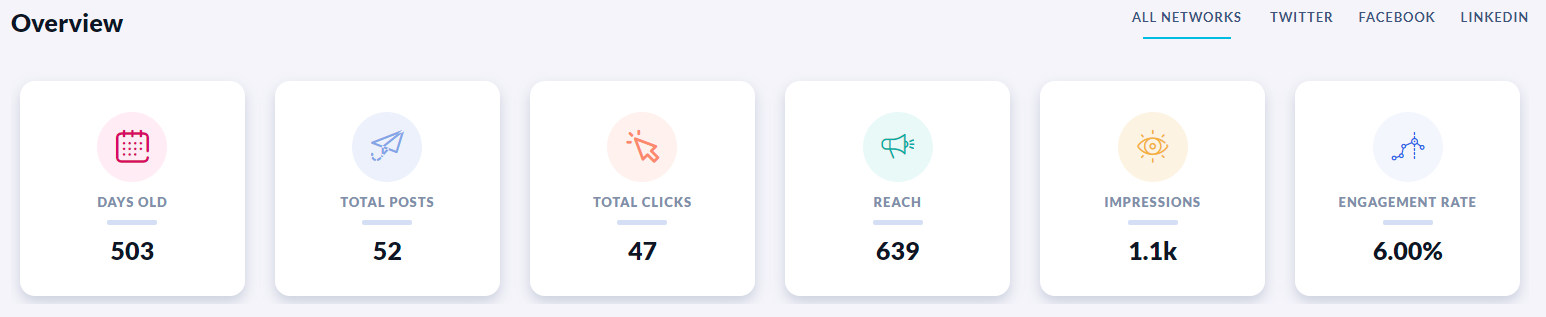
- Days old - This tells you the age of this campaign in days - have you passed any major milestones?!
- Total posts - Just to make it crystal clear, this is the total number of posts that have been associated to this campaign.
- Total clicks - The total number of times links in all posts in this campaign have been clicked - simple!
- Reach - This gives the number of different people who see your posts each day. We get this number by dividing the total reach for the reported time period by the number of days in the reported time period. For Twitter, the calculation is slightly different as they don't report on reach (boo!). Instead, we estimate this by looking at how many followers the account that posted has, as well as how many people follow anyone that retweets the post.
- Impressions - This gives the number of times per day your post has been shown on a person's screen. We get this number by dividing the total impressions for the reported time period by the number of days in the reported time period, regardless of whether or not the same person has seen it multiple times.
- Engagement rate - This shows the level of engagement the content you've shared has generated during the campaign. We get this percentage by dividing the total number of engagements on all posts associated with the campaign by the total number of impressions and multiplying this by 100. Depending on the data provided by the social network, engagements can include Likes, Comments, Shares, Clicks and Reactions.

- Video Views - How many times your video has been viewed
- Average View Time - On average, how long your videos were view for (in minutes)
- Impressions - How many times your posts with videos attached were seen
- Reach - How many unique individuals saw posts with videos attached
- Link Clicks - How many clicks there were on links shares in the copy of your video posts
- Likes - How many likes your video posts received
- Comments - How many comments your video posts received
- Shares - How many shares your video posts received

- Story Views - The amoutn of times your Stories have been viewed
- Reach - The amount of unique accounts that viewed your stories
- Tap Back - How many times people tapped back when viewing your story
- Tap Forward - How many times people tapped forward when viewing your story
- Exit Story - How many times people exited viewing your story
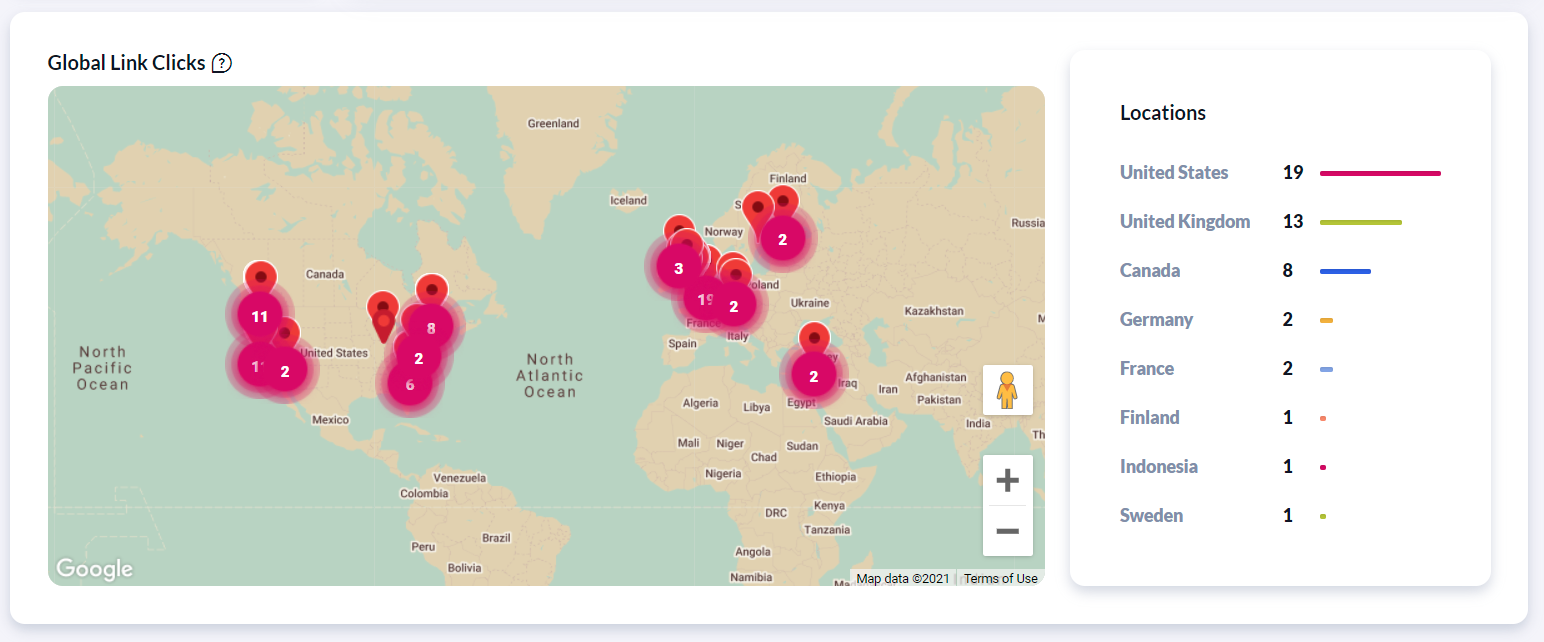
- Global link clicks - This graph shows you the location of link clicks across all networks, but these can only be tracked if the customer has Location Services enabled.
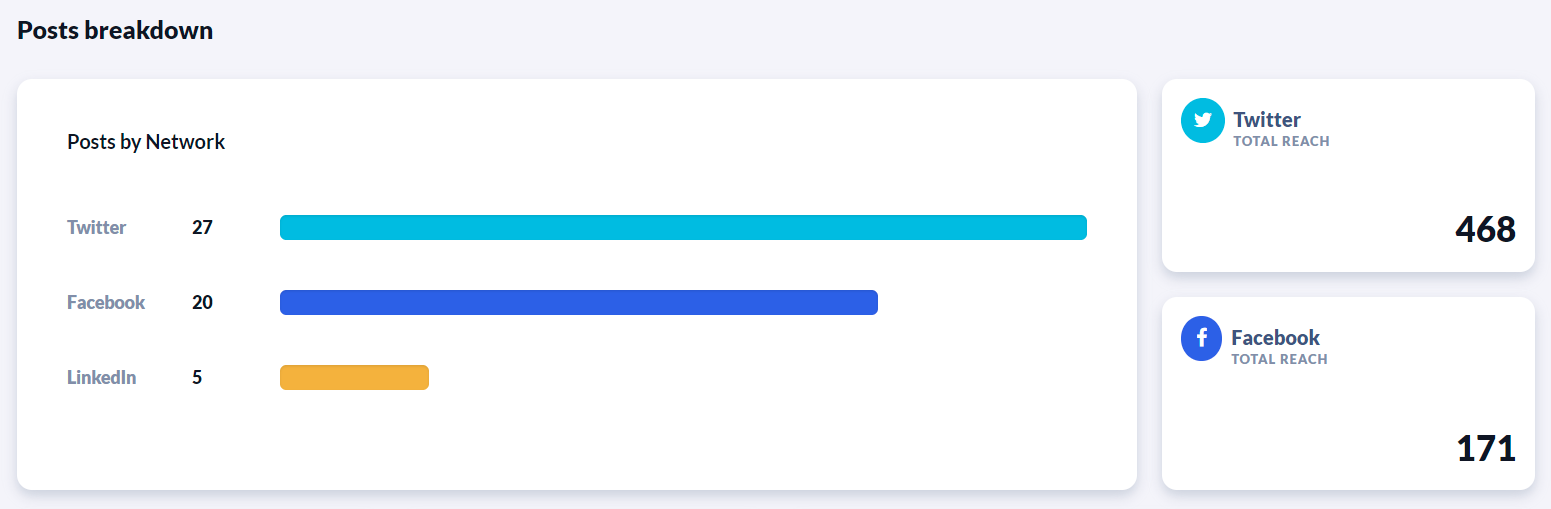
- Facebook Total Reach - This tells you the total number of times the posts in this campaign have been seen by different people, as provided by Facebook.
- Twitter Total Reach - This gives you an idea of the total number of times the posts in this campaign have been seen by different people. This is an estimate as Twitter does not provide this figure.
- Instagram Total Reach - This tells you the total number of times the posts in this campaign have been seen by different people, as provided by Instagram.
- LinkedIn Total Reach - This tells you the total number of times the posts in this campaign have been seen by different people, as provided by LinkedIn.
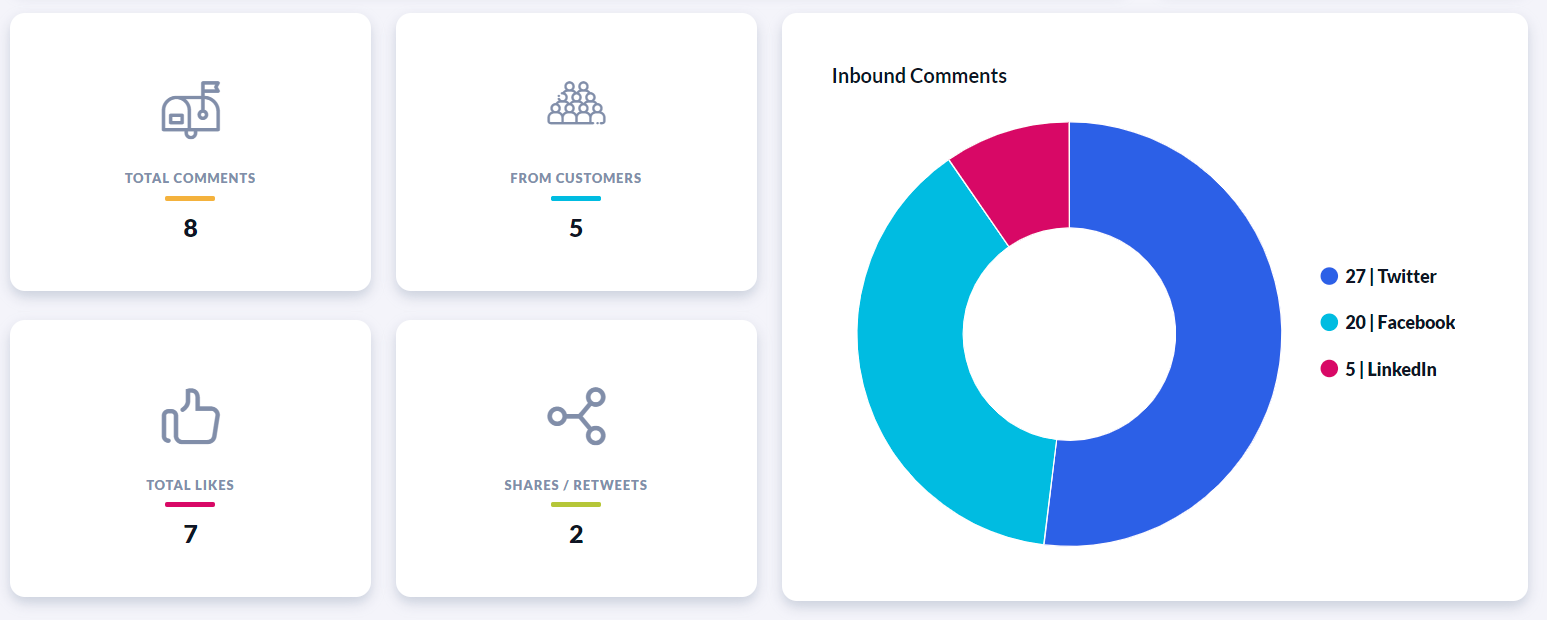
- Total Comments - This is the total number of public comments or mentions received for the reported time period.
- From Customers - This is the total number of different people who posted a public comment or mention.
- Inbound Comments - This is the total number of public comments or mentions received for the reported time period, broken down by network.
The campaign report will also include data from posts that have been deleted, so you can still see their impact on your overall metrics.