/Orlo%202.0%20Logo.png?height=120&name=Orlo%202.0%20Logo.png)
Making heads or tails of your Analytics is key to understanding your success and identifying areas of improvement, as well as making it easier to shout about your amazing ROI. We’ve put this glossary together to ensure every bit is easy to digest.

- Followers - You already know the basics - this tells you the number of people who follow your account. If you view these numbers natively, they may be called something different. For example, on your LinkedIn Company Page they will be called connections, on Facebook it's the number of people who follow your page and on YouTube it's the number of subscribers you have.
- Account Impressions - This gives you the total number of times your content has been shown on a person's screen across the whole account, regardless of when the content that generated the impression was published. Please note that Twitter doesn’t provide this statistic.
- Post Impressions - This gives you the total number of times your posts have been shown on a person's screen, regardless of whether or not the same person has seen them multiple times. We get this number by totaling daily stats from the native provider. Here we only count impressions from posts published within the range of the report, but we will include impressions recorded on those posts after the date range.
- Account Reach - This gives you the total number of times your content has been seen by different people, for content published across the whole account. As with Account Impressions, we look at reach generated within the range of the report, from content published at any time. Please note that Twitter doesn’t provide this statistic.
- Post Reach - This gives you the total number of times your posts have been seen by different people, for posts made within the date range. If your posts published within the range of the report have been seen after the date range, then you'll see this reflected in the number as well. Please note that Twitter doesn’t provide this statistic.
- Link Clicks - This is the number of times the links in your posts have been clicked - simple!
- Published Posts - This is the number of public posts you have published from the selected accounts.
- Post Engagement Rate - This shows the level of engagement the posts you've published have generated. We get this percentage by dividing the total number of engagements on a post by the total number of impressions and multiplying it by 100. Depending on the data provided by the social network, engagements can include Likes, Comments, Shares, Clicks and Reactions.

- Video Views - How many times your video has been viewed
- Average View Time - On average, how long your videos were viewed for (in seconds)
- Impressions - How many times your posts with videos attached were seen
- Reach - How many unique individuals saw posts with videos attached
- Link Clicks - How many clicks there were on links shares in the copy of your video posts
- Likes - How many likes your video posts received
- Comments - How many comments your video posts received
- Shares - How many shares your video posts received

- Story Views - The amount of times your Stories have been viewed
- Reach - The amount of unique accounts that viewed your stories
- Tap Back - How many times people tapped back when viewing your story
- Tap Forward - How many times people tapped forward when viewing your story
- Exit Story - How many times people exited viewing your story
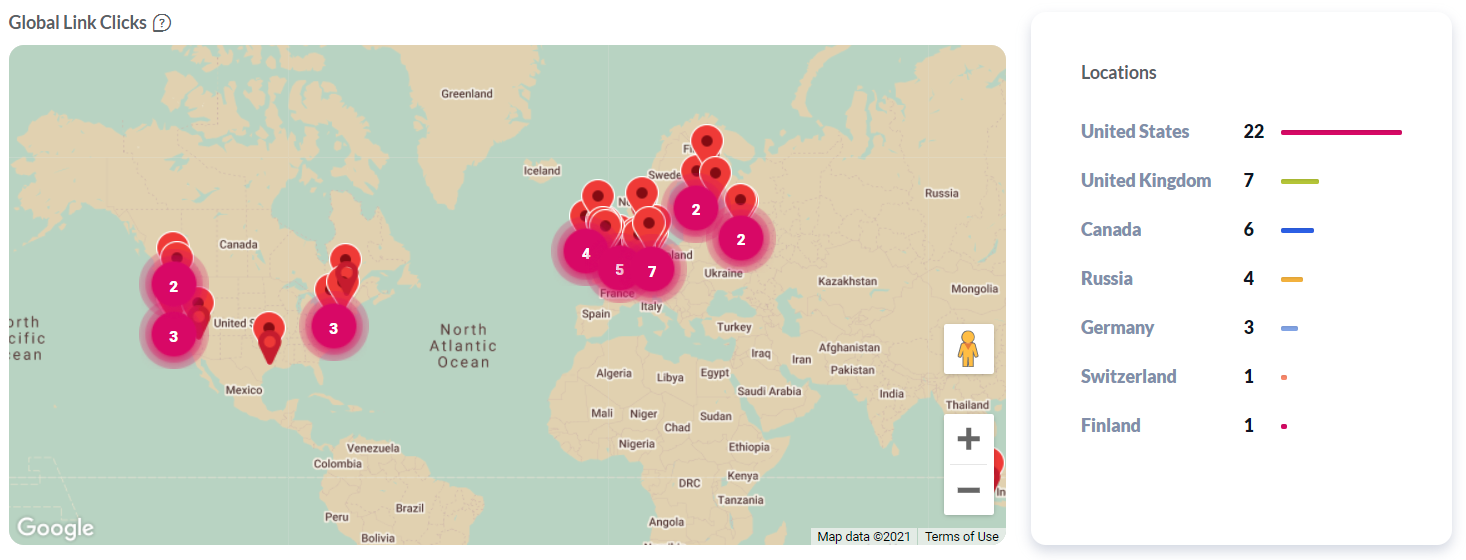
- Engagement Location - This map shows the location of where your posts Link Clicks came from, as long as the person clicking on the link has Location Services enabled (and they are where they say they are!).
- Brand Sentiment - These figures show the sentiment of the public comments or mentions received for the reported time period.

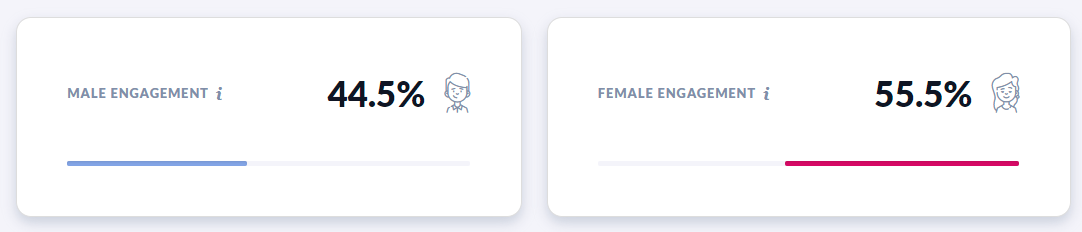
- Gender Breakdown - We understand these metrics aren't inclusive, which we know sucks! This metric is a combination of limited information on the gender of customers and best assumptions based on things like user name, so we recommend approaching this one with caution
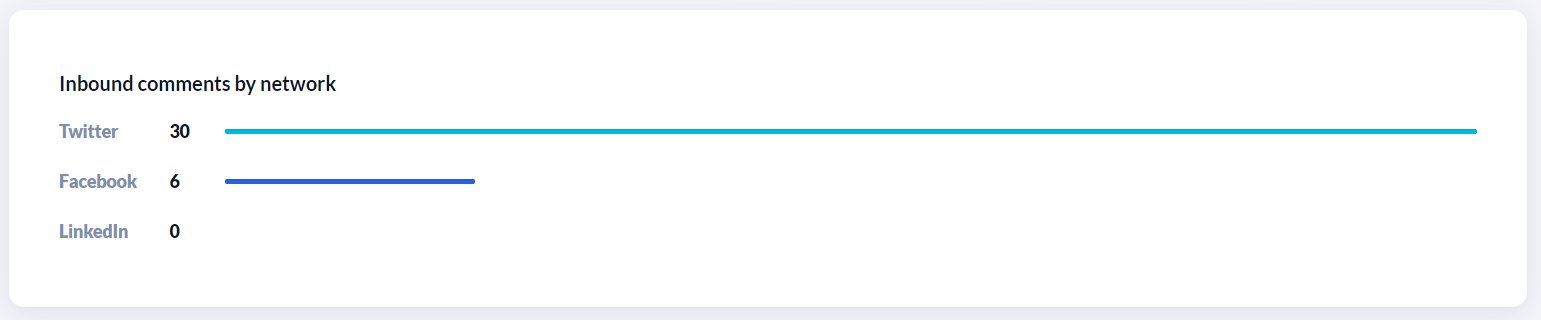
- Inbound comments by Network - The social network from which your accounts received a message.
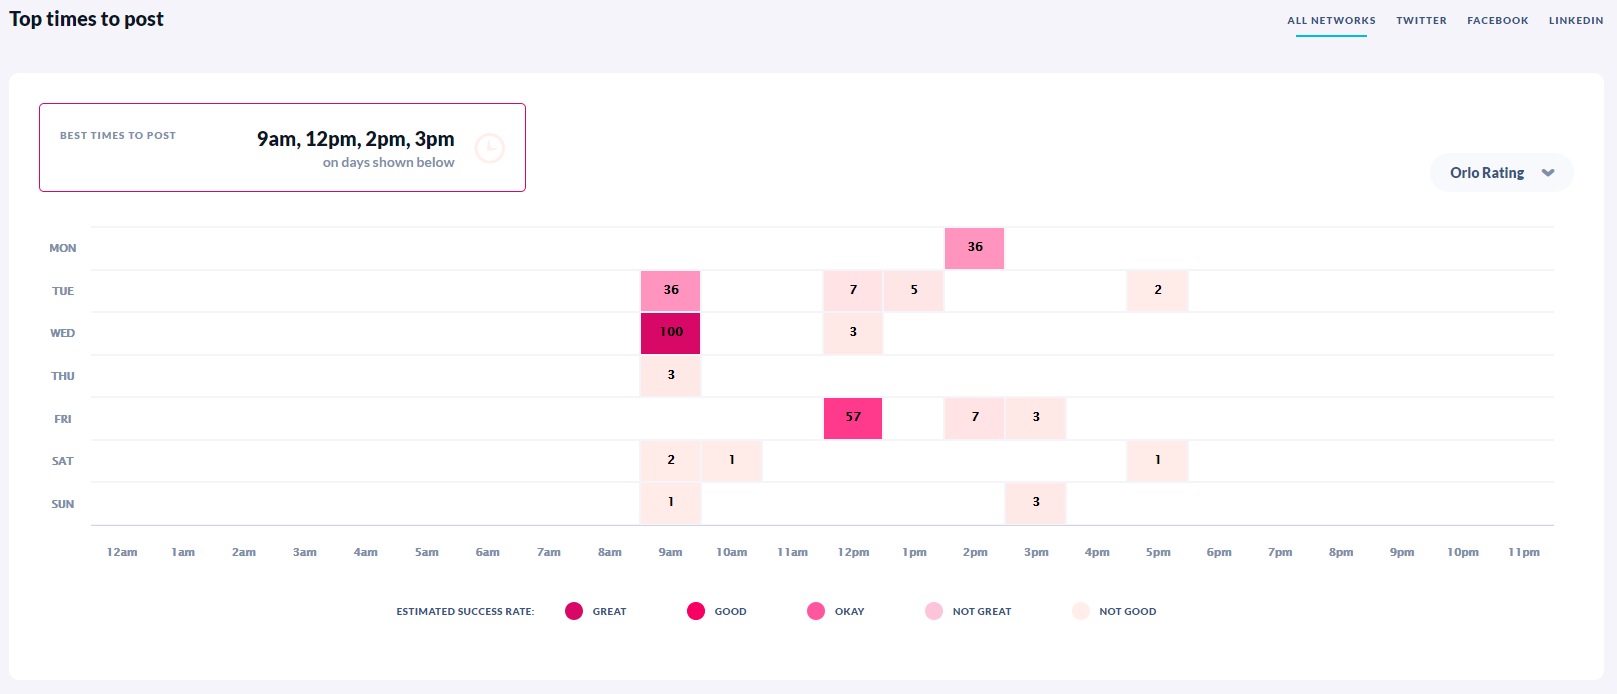
- Top Times To Post Out - This graph shows the best times to post based on the level of engagement in your previous posts. The post with the most engagement in the reported time period will have a score of 100, with all other posts scored as a percentage of this peak. It's simple once you know!
Note: For Account Reach and Impressions, we will also include any Ad or Story post data where the social networks provide them.
The Marketing Report will also include data from posts that have been deleted, so you can still see their impact on your overall metrics.